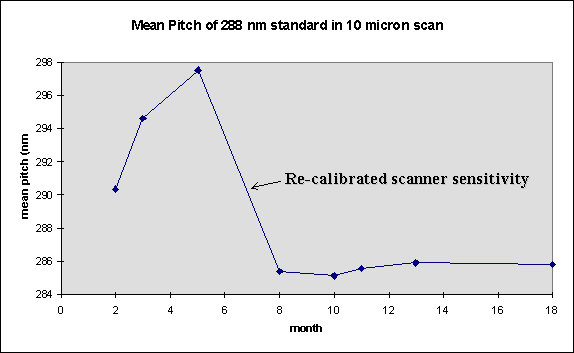
Typical QC Chart for an SPM.
Evaluate the drift in magnification over time:

We scanned a 288 nm pitch calibration standard and analyzed the results using DiscTrack PlusTM. This graph shows that the apparent magnification drifted upward before recalibration. For 10 months after recalibration, the magnification was nearly constant. The standard error of mean was about 0.8 nm.
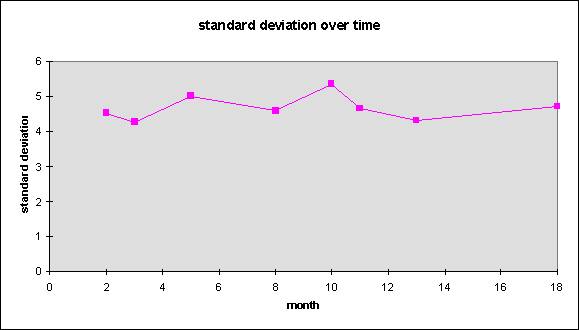
Interestingly, the standard deviation was approximately constant over the same time interval:


