Overview
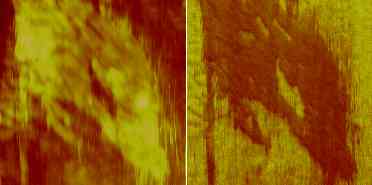
These two sets of images compare phase and friction contrast. The purpose of this experiment was to establish a correlation between the material/chemical contrast seen in phase imaging with the contrast seen in friction imaging, an older technique. In order to make the comparison, we had to change the probe tip (from a Si tip used for Tapping Mode/phase imaging to a SiN tip used for contact mode/friction imaging). So, these images also demonstrate our capability of re-positioning the probe to the exact same spot on the sample, within 100 nm. (See “How to relocate…” below.)
Contaminants on glass.
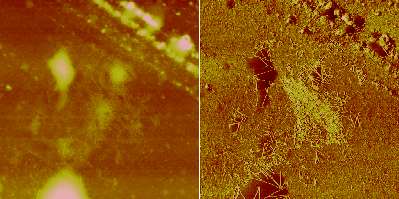
This material is the residue of fingerprint contamination on a glass slide. We first wiped the slide with a clean tissue, applied a fingerprint and wiped it again. Some residue was visible in the optical microscope, so we scanned the AFM at that spot.

Contact Mode (5 um scan)
In contact mode, the friction image (right) showed two prominent areas of high friction (bright) and one area of low friction (dark). In the height image (left) there was little topography corresponding to the high friction areas, but there was a raised area corresponding to the low friction area.

Tapping Mode (5 um scan)

Tapping Mode (1 um scan)
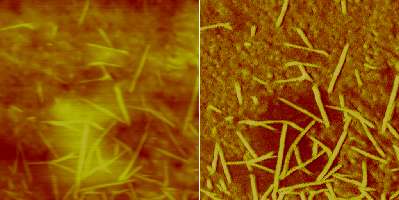
In Tapping Mode images of the same area, the high friction spots appeared as raised bumps (bright) in the height image (left) and as dark areas (low phase) in the phase image. The low friction area appeared bright in the phase image, with considerable fine structure not seen in contact mode. We interpret these observations as follows:
The high friction/low phase areas are microdroplets of viscous oil. The low friction/high phase areas are solid crystallites, which in some cases are floating on the oil.
In contact mode, the probe tip slides on the solid surface, here the glass substrate.
In Tapping Mode, the probe tip can track the liquid-air interface of the oil droplets, since the viscoelastic properties of the oil make it stiffer at high frequencies. Shear forces present in contact mode, but absent in Tapping Mode, account for the poorer resolution of the contact mode image.
Wood Pulp Fiber
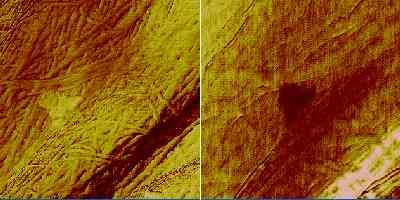
The Tapping Mode phase image (left) shows a bright (high phase) region. The contact mode friction image (right) shows that the friction is low (dark) on the same area. Note that the fine structure (cellulose microfibrils) was more easily seen in the phase image.

1 um scan
How to relocate to a given spot
The key is planning. The general concept of finding the same spot on a sample is as follows. Create or note landmarks at a series of length scales. This would include AFM images of 1-10 micron fields of view as well as optical images of 100-1000 micron fields. Using the mechanical stage controls of the Dimension 3000, we note the positions of various optical landmarks within 10 microns. We also note the rotational orientation of the specimen within 1-2 degrees. In addition, it is necessary to take account of the shift in probe tip position, by aligning the image relative to the video crosshair during the ‘focus-tip’ operation. With sufficient information, as described above, we have found it possible to find and re-examine the same spot on a specimen after a 1-month interval.


